The phrase “location is everything” is true not only in real estate but also when preparing for a specific threat from a hurricane. Pinpointing where it most likely occurs is essential to effectively positioning resources.
The same could be said about timing. Knowing when a hazard is most likely to occur can help you avoid making the costly mistake of responding too early or, even worse, too late.
Both minutes and miles matter when planning for and responding to hurricanes, and here’s why weather data built for your GIS system is a perfect fit for your hurricane continuity of operations plan.
Firsthand Experience During Hurricane Helene
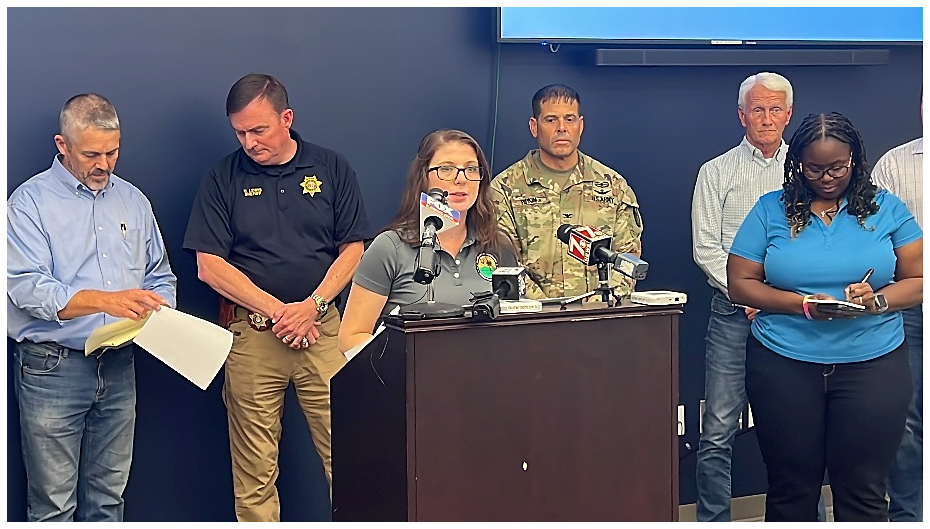
I witnessed firsthand how crucial timing and location were during Hurricane Helene in 2024. A slight shift in the storm's track and forward speed significantly increased the wind impacts across the South Carolina Upstate. This led to 95% of my county losing power and over 1 million cubic yards of debris needing to be cleared. The experience reinforced my conviction that a strong emergency response relies not just on accurate data, but also on being aware of where resources and assets are in relation to the hazards.
Visualizing both in a GIS application can significantly improve a disaster response plan by enabling real-time data analysis. This helps responders quickly identify affected areas, allocate resources efficiently, and enhance communication, ultimately saving lives. The decision to suspend emergency services during a hurricane is never easy, but GIS-ready data can empower your team to make these decisions sooner and more confidently.
Conversation with an Esri Expert on the Power of GIS

Baron Weather is an Esri Gold Partner, providing smarter weather data to organizations with the same goal: keeping people and property safe. I spoke to Carrie Speranza, Director of Emergency Management Solutions at Esri, to better understand the value a GIS solution can bring to all phases of emergency management. The dialogue below has been edited for flow, and visuals added for context.
Jessica: Carrie, let’s start with the big picture—how does GIS bring an operations plan to life?
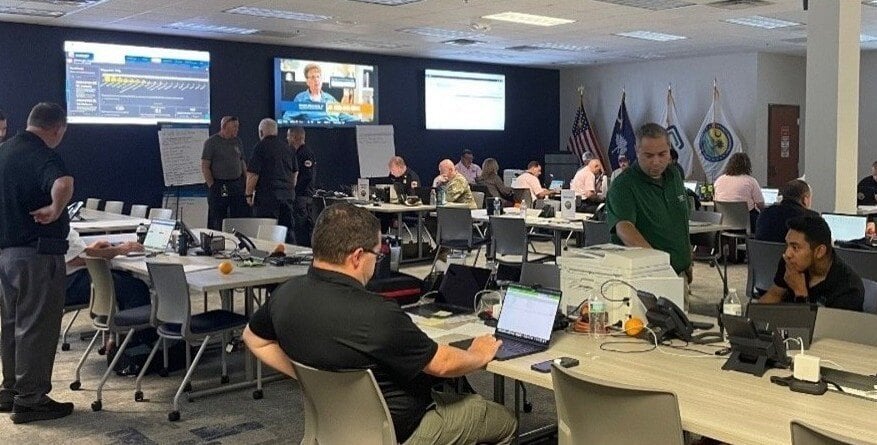
Carrie: GIS is all about applying the geographic approach to problem-solving. It gives you tools to measure, visualize, analyze, predict, plan, and communicate. Integrating all your data feeds into a GIS-based common operating picture gives your emergency operations center real situational awareness.
Jessica: And how does that support decision-making?
Carrie: It really takes it to the next level. Especially during emergencies, decisions need to be fast and accurate. That’s where specialized feeds—like Baron’s weather intelligence—come in. They help emergency personnel act with confidence. Whether it’s issuing evacuation orders, rerouting traffic, or staging supplies, having the right weather data makes all the difference.
Jessica: But in our case, as emergency managers, it’s not always how accurate the data is; it’s often just as important to understand how it will affect us. Or our people.
Carrie: Right. It’s about predicting the impact of the weather. Tailored weather data can give you alerts and warnings specific to hazards and regions. That lets emergency teams focus their resources where they’re needed most.
Jessica: Now let’s talk about an ArcGIS Solution, such as Watch Center. How can it help organizations make real-time decisions during hurricanes?
Carrie: One of the biggest challenges emergency managers face is keeping up with dozens of real-time data feeds—weather, transportation, social media, news, public safety dispatch, facility status boards, and more. Monitoring all of that is a huge workforce challenge.
Jessica: That is a lot to manage. And my biggest fear has been something that gets missed because of so many competing priorities.
Carrie: That’s the risk. A single missed signal could lead to devastating loss—lives, property, infrastructure. That’s why Esri developed the Watch Center solution. It’s designed to help teams work more efficiently, even when they’re off duty. It brings together tools to monitor and analyze threats and hazards in one place, simplifying the process and eliminating a lot of manual steps.
Jessica: What about the role of GIS specialists on emergency management teams? We know the current financial climate isn’t easy for an agency to navigate. What are the justifications for emergency managers to invest in the resources for GIS?
Carrie: GIS is a critical piece. Emergency managers know that location is at the root of all risk. The first question we ask is always “Where is the incident happening?” Then we ask, “What’s it like there?”
Jessica: And GIS applications can help answer those questions, right?
Carrie: Well, it does even more than that. Geospatial science helps us answer the “why” and the “so what”—the questions leadership really cares about. Emergency managers of the future will need to solve problems in new ways. Those who embrace technology will thrive. Those who don’t? They’ll fall behind.
Jessica: I guess it’s fair to say GIS specialists are more than just mapmakers.
Carrie: Way more. They’re frontline intelligence analysts. They don’t just make maps—they collect data, organize it, tell a story, and share it with leadership. They’re constantly analyzing trends, assessing impacts, and creating visual stories that drive critical decisions. Their role is essential—not just in response, but in preparedness, mitigation, recovery, and resilience.
How the Esri-Baron Partnership Can Help
The partnership between Baron Weather and Esri is a powerful alliance for emergency management. By integrating Baron’s weather data into Esri's ArcGIS applications, emergency managers gain access to a vital resource that significantly enhances their situational awareness and decision-making capabilities.
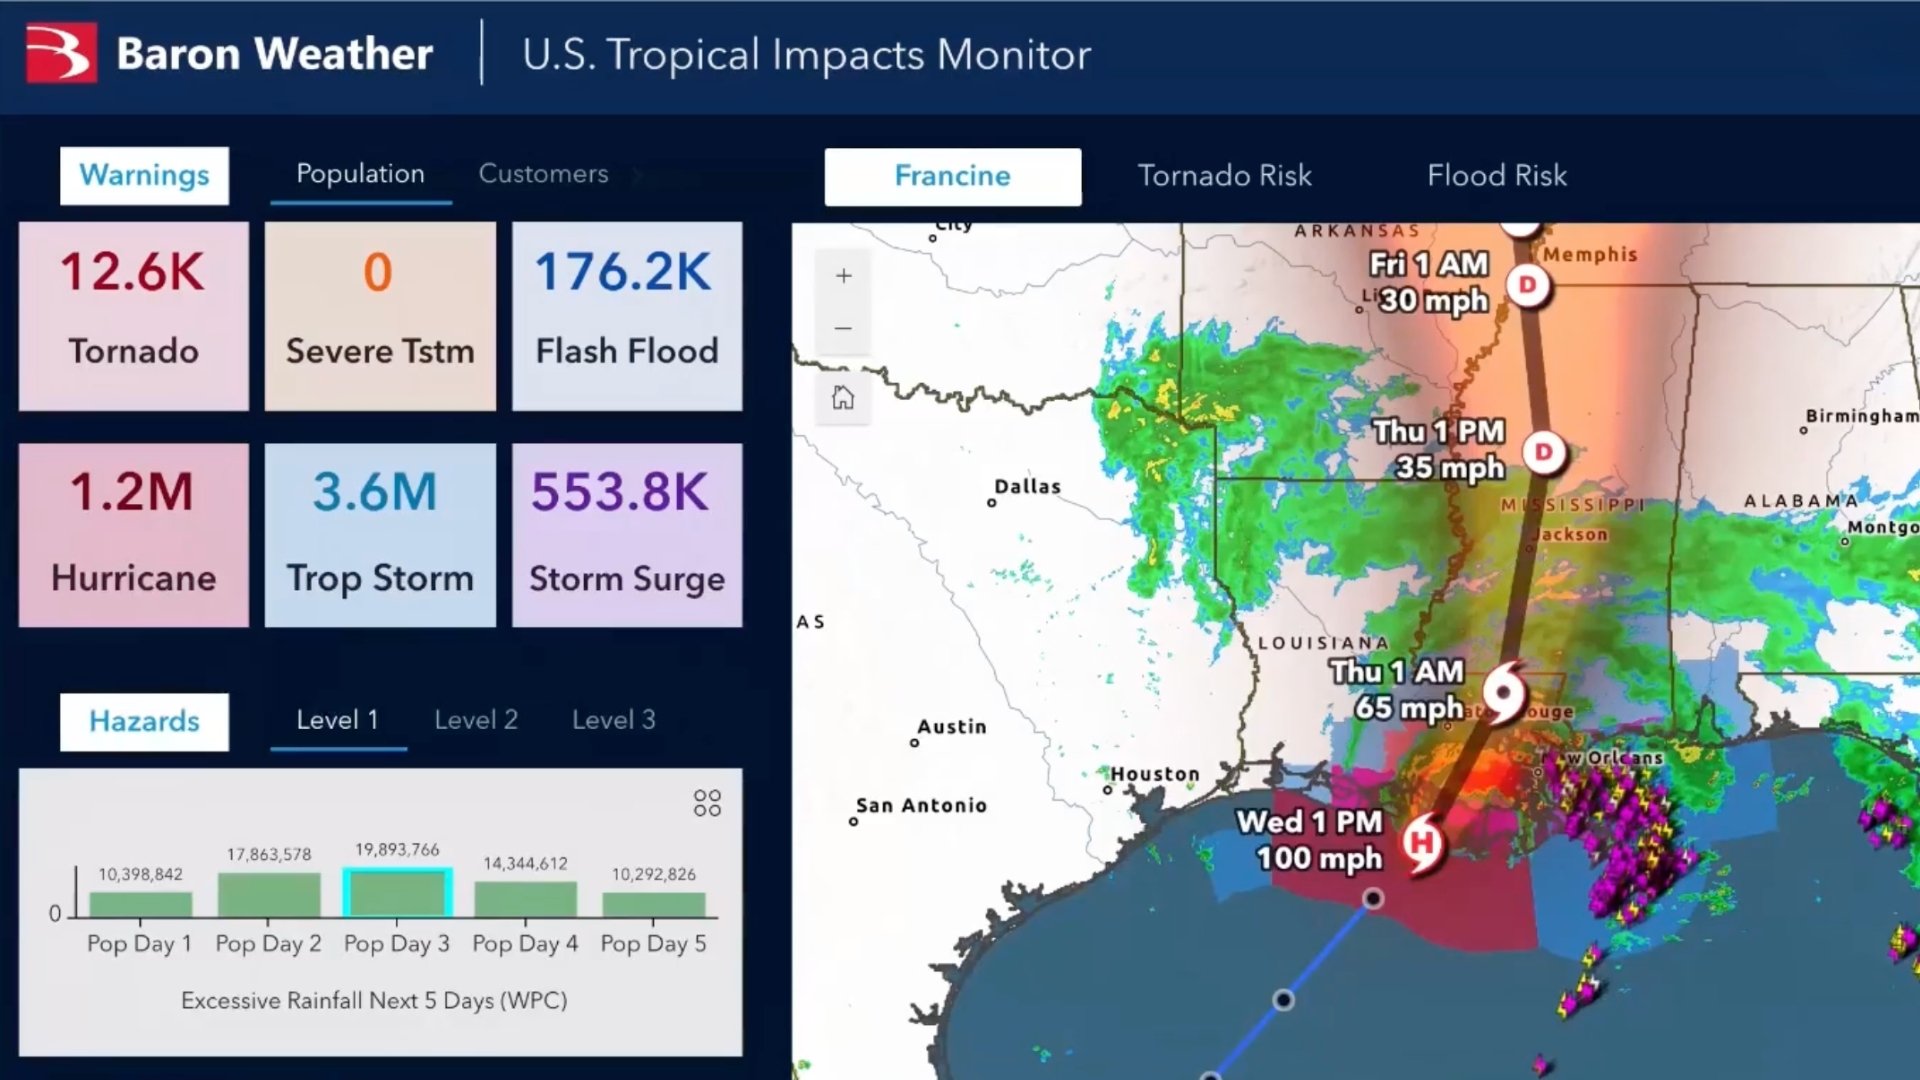
Below are summarized examples of the immediate impact Baron’s advanced weather data can have on your organization’s GIS application during hurricane season. This is in addition to the publicly available data feeds from the National Hurricane Center or National Weather Service that you would also receive as a service from Baron.
All Baron GIS-ready data layers can be used for alerting, dashboards, visualizations, and briefings. They are ready “out of the box” and fit perfectly into an ArcGIS Dashboard, Web Map, Experience Builder, or custom GIS application built with the ArcGIS backbone.
